Search & PMax ROAS
12x+
north of 12x across our travel accounts (Sunny first-party benchmark, as at Jun 2026)

You are one of the rare tourism brands where the demand already exists. The name does the awareness work. The real game is yield and where the booking happens, not reach.
A 125-year-old steam railway in the Dandenongs does not need to be discovered. It needs to be captured at the right moment, at the right price, on your terms.
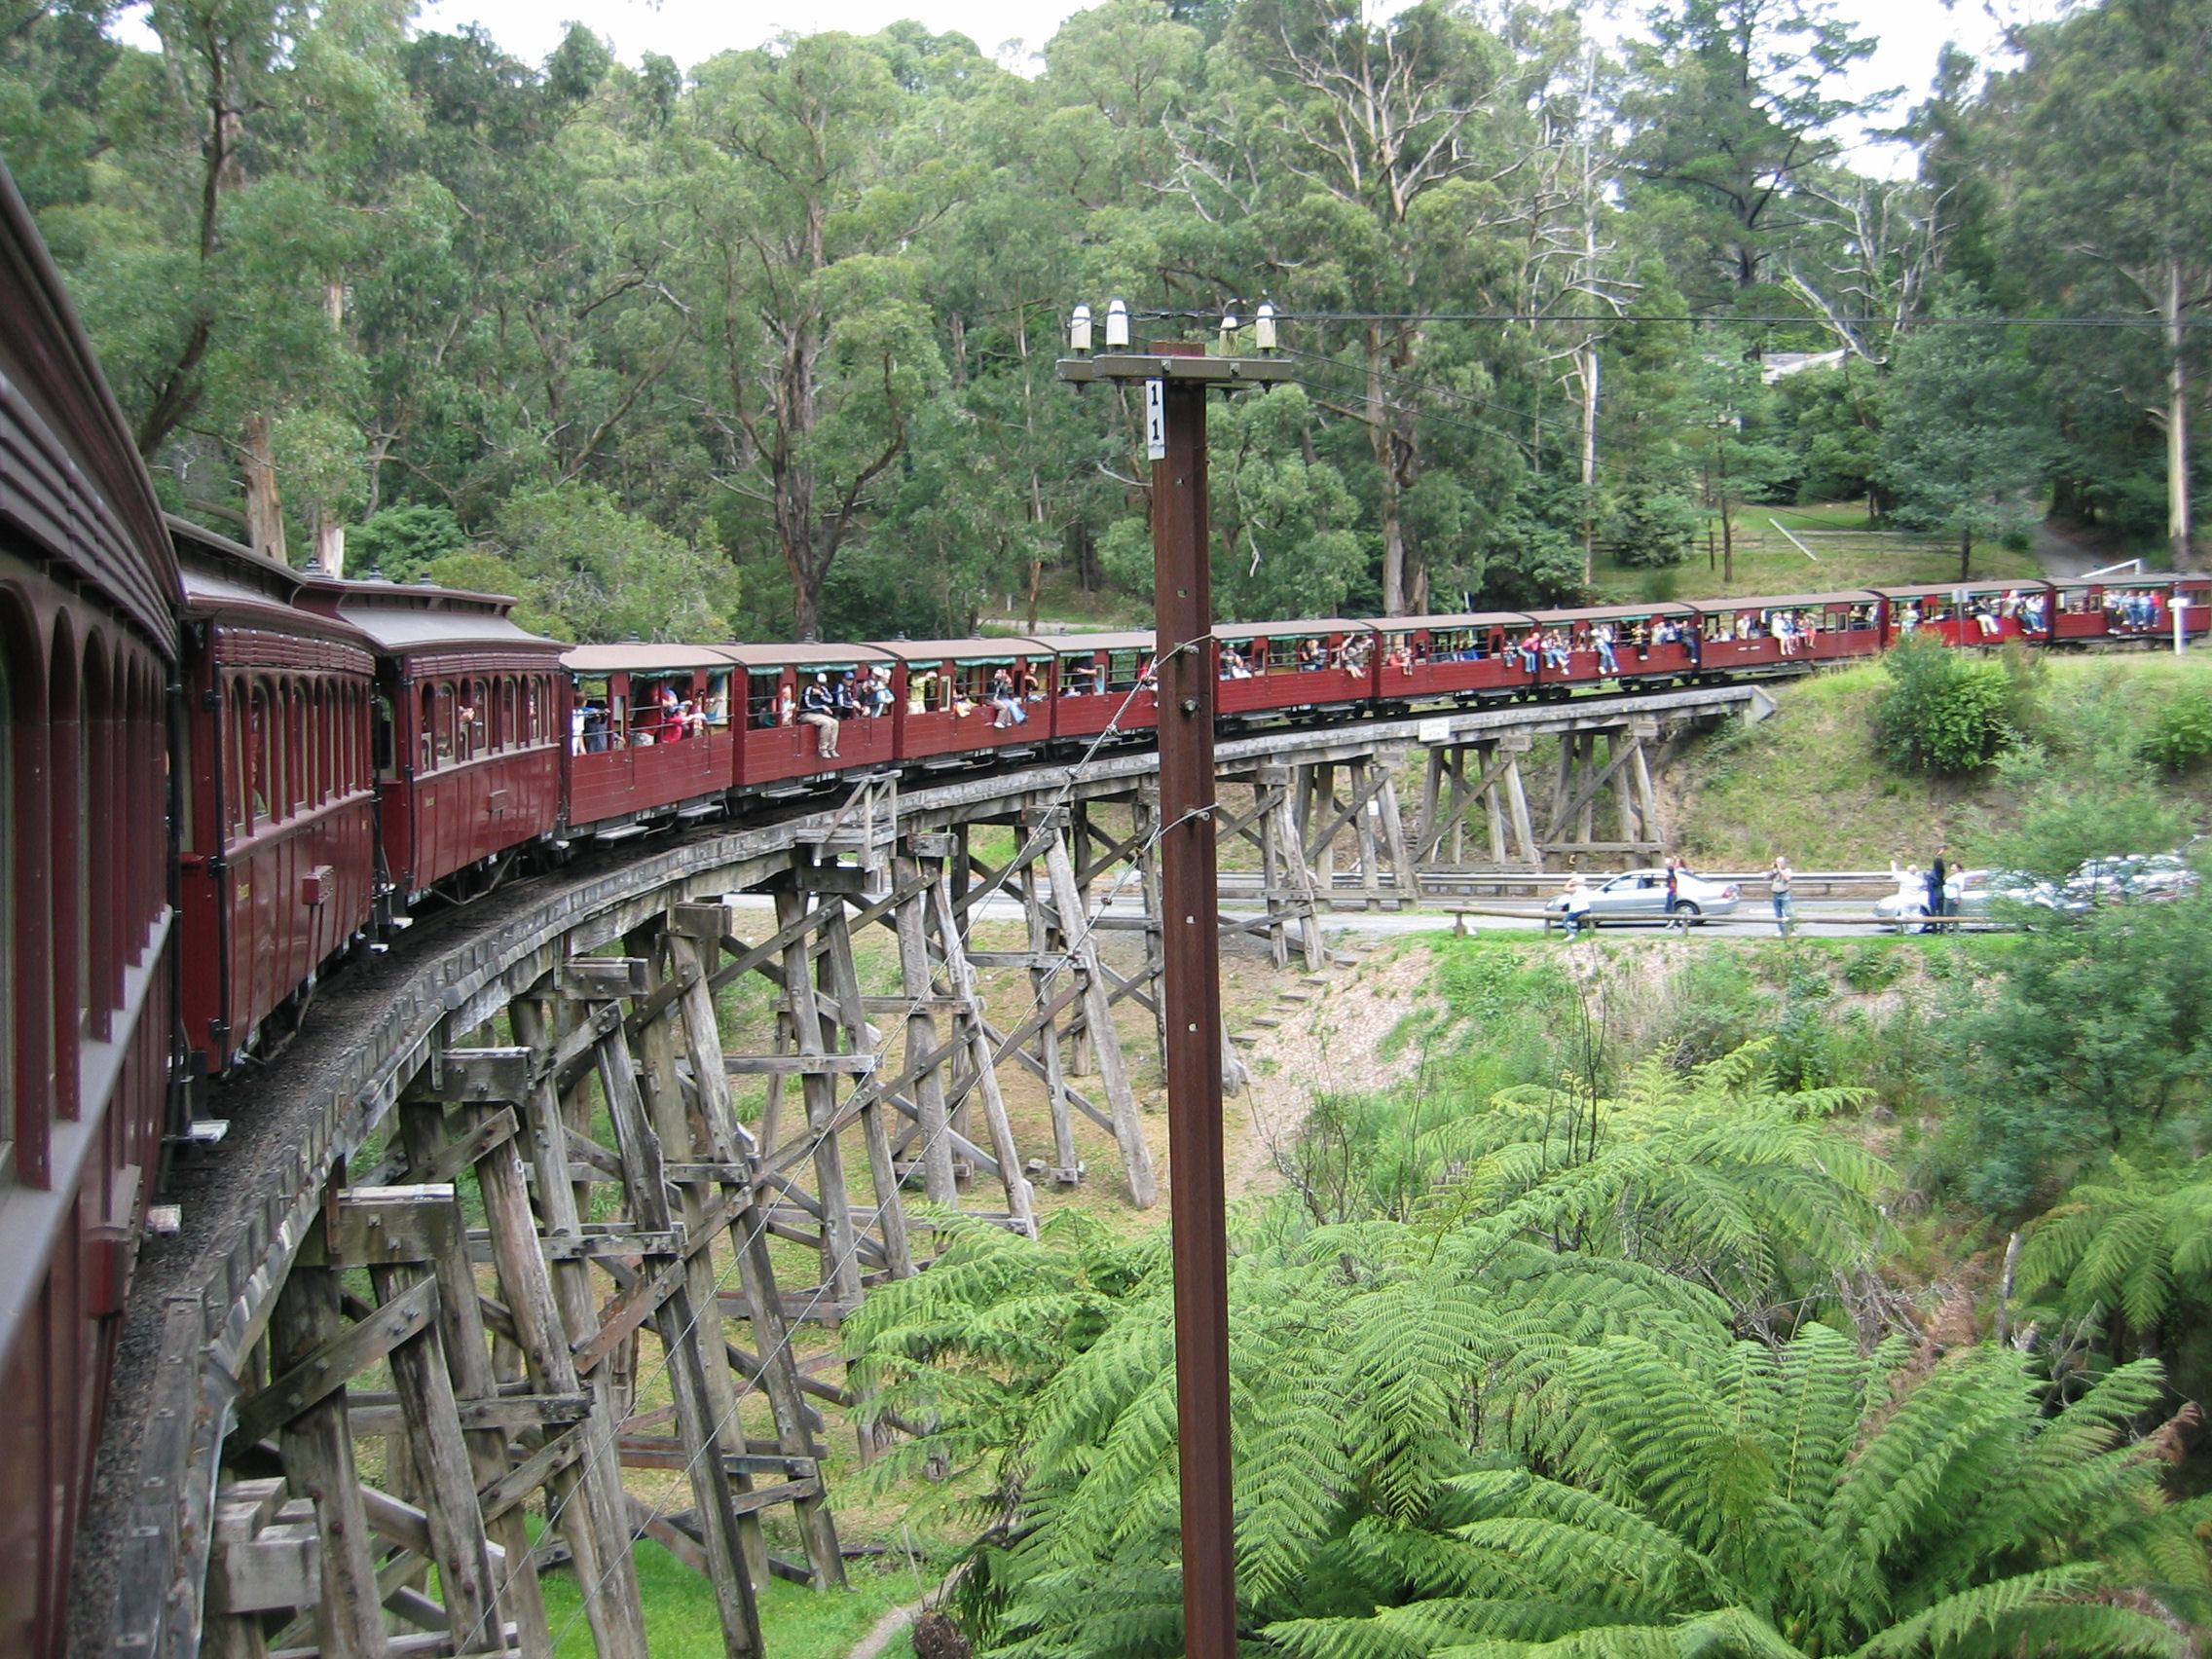 Wikimedia Commons
Across Australian travel and tourism, newspapers pulled the single largest slice of measured spend last year, ahead of every digital channel (Nielsen Ad Intel, as at Dec 2025). For a destination attraction like yours, that is a gift. The planning and booking journey has moved to a phone, and a huge amount of competitor budget is still parked in print.
Puffing Billy does not need to buy attention. It needs to intercept intent in the window where a family or an international visitor is actually deciding how to spend a day near Melbourne.
Tour operators and OTAs take the lion's share of category spend. Attractions and destinations sit well down the list, which means the auctions you actually care about are less crowded than the headline number suggests. The people bidding hardest are selling something different to you.
Tour operators and OTAs dominate; pure destinations are underweight · Source: Nielsen Ad Intel, as at Dec 2025
The category peaks in January and bottoms out in December. For a school-holiday and summer-driven attraction, that rhythm is even sharper than the average line shows. The mistake we see most often is spending flat across a year that is anything but flat.
January peak, December trough across the category · Source: Nielsen Ad Intel, as at Dec 2025
We would map your actual booking curve against the school-holiday calendar and show you where a dollar works twice as hard.
Let's talkInternational visitors book Melbourne day-trips three to six weeks before they land, while still overseas. If you are only visible once they arrive, a reseller has already taken the sale.
OTAs and aggregators run ads on "Puffing Billy" as a search term. You often pay resellers a commission to send you traffic that was already searching for you by name.
Day-trip demand spikes on the back of a clear-weekend forecast. Bidding that responds to a three-day forecast, not a monthly plan, captures the surge before competitors adjust.
For heritage attractions, a single strong still of steam over the trestle bridge consistently beats polished video on cost per click. People already know the feeling; they want to picture themselves in it.
The margin is not in the standard ticket. It is in premium carriages, dining experiences and events. Those need their own audiences, not a line item on the generic campaign.
Generic summer targeting wastes budget. The demand steps up on exact term-break dates that differ by state, so a Sydney family and a Melbourne family plan on different weeks.
These are our delivered results across Australian and New Zealand travel and tourism accounts, kept deliberately loose. They are the yardstick we would hold Puffing Billy's campaigns against.
Audit who is bidding on "Puffing Billy" and how many of your paid clicks are simply buying back demand that already exists. Every reseller commission on a branded search is margin you can keep.
Build audiences that reach international and interstate visitors while they are still planning the trip, weeks before arrival, so you are the default choice before a reseller becomes it.
Split the high-yield experiences (dining trains, premium carriages, events) into their own campaigns with their own audiences. That is where cost per purchase justifies a much higher bid.
This is the outside view. The real work starts with your booking data, your reseller split and your true seasonal curve.
We've done this for travel & tourism brands right across Australia. See the campaigns, and the results, for yourself.
Check out our success storiesHere is the lever. If a meaningful share of your annual ticket revenue currently routes through resellers and OTAs at commissions in the 20 to 25 percent range, shifting even part of that to direct booking recovers pure margin, not new sales you have to fight for. On the ticket volumes a railway of your scale moves, that recovered margin is comfortably north of seven figures at the top end. It is the first number we would chase, because the demand already exists and you are paying to rent access to it.
Give us your booking split and seasonal curve and we will show you exactly where the recoverable margin sits, and how fast.
Just hit replyWe map spend against your actual demand by state and school-holiday calendar.
Where you are paying commission on demand you already own.
How to sell premium experiences at a cost per purchase that stacks up.